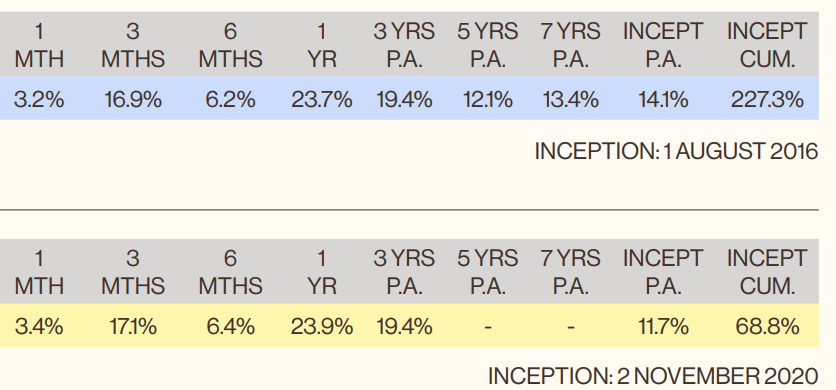
I am manually typing the graph performance index values to capture historical periodic performance, so would be good to have a report that would spits this out
Seems this didn’t get traction? Pretty much all fund managers report like this so it would be very good to have please. This multi period report as it is now is unwieldly. Also the excel spreadsheet it puts out for download doesn’t contain the Groupings in the Combined spreasheet?? A bit useless as you can’t ‘roll up’ or view the performace over each time period by you chosen grouping??